# OpenStreetMap data layers (Overpass)
Mapforge enables you to add custom data layers from OpenStreetMap using **Overpass queries**. Overpass is a powerful search language for map data: You can find specific places, roads, buildings, or any feature mapped in OpenStreetMap's global database.
Overpass layers get loaded for the currently visible view of the map. When the map gets moved or zoomed, a reload button appears to fetch data for the new area.
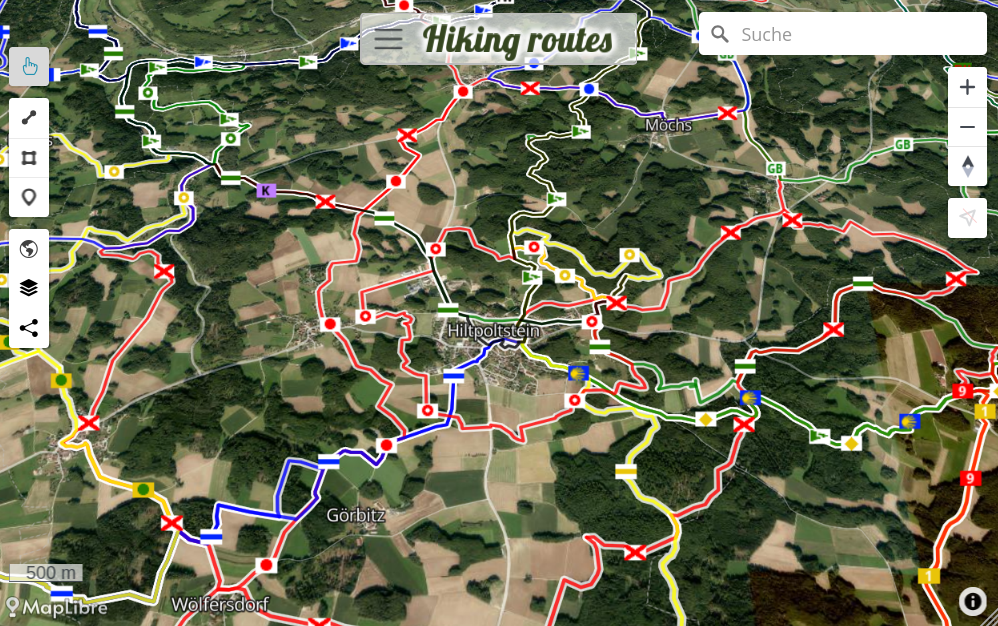
*(Screenshot from hiking routes map, see [source map](https://mapforge.org/m/49ee89e4/Hiking%20routes) )*
### Pre-defined Overpass layers
Mapforge has a couple of ready-to-use layers prepared that can easily get added to your map.
Open the 'Layers' window, click on 'Add layer' and chose the query to add.
There are prepared queries to cover common mapping needs for example for public toilets, camp sites and hiking tracks.
### Custom Overpass layers
Overpass queries are defined in [Overpass QL](https://wiki.openstreetmap.org/wiki/Overpass_API/Overpass_QL) (short for "Overpass Query Language").
This powerful language lets you query any data available in OpenStreetMap. You can browse the [official tags list](https://wiki.openstreetmap.org/wiki/Map_features), [taginfo.openstreetmap.org](https://taginfo.openstreetmap.org/), or the 'Query Features' option on [openstreetmap.org](https://openstreetmap.org) to discover interesting tags to create queries for and include in your map.
A simple overpass query for showing all beehives on the current map view would look like:
`// marker-symbol=🍯`
`nwr["man_made"="beehive"];`
`out center;`
To load for a specific area and not the current map view, add a bbox tag in the frst line, like: `[bbox:49.3148,10.4681,49.5827,11.6801];`
You can enhance your layers with visual customization, for example setting symbols or icons for clusters and markers. This can be achieved by adding one or more of these settings as comments to the query:
* `// heatmap=true` - Results will be rendered as a heat map (default=false)
* `// label-property` - OSM property that will be shown as label (default=name)
* `// marker-color=yellow` - Color of marker points
* `// marker-symbol=🍻` - Nodes/points will use this symbol (emoji)
* `// marker-image-url=/icons/hydrant.png` - URL pointing to icon image
* `// stroke=yellow` - Outline color for points, lines and polygons
* `// stroke-width=4` - Outline width for points, lines and polygons
* `// fill=yellow` - Fill color for polygons
* `// fill-opacity=0.5` - Fill opacity for polygons
* `// cluster=true` - Results will be clustered when too many results are close to each other (default=true)
* `// cluster-color=yellow` - Color of cluster points
* `// cluster-symbol=🍻` - Emoji/icon path used for clusters
* `// cluster-image-url=/icons/hydrant.png` - URL pointing to icon image for clusters
Other recommended sites that can create maps from Overpass queries are: [overpass-ultra.us](https://overpass-ultra.us) and [overpass-turbo.eu](https://overpass-turbo.eu).